U.S. COVID-19 Cases and Mask Mandates Impact On Ecommerce Purchase Rate
by Wei-Shin Lai, MD
December 11, 2020
Our governor just announced that he is positive for the coronavirus, and the US reported more than 3,000 deaths in a day. Meanwhile, holiday ecommerce sales continue.
We compare our sales pre-pandemic (2019) to the pandemic (April-November 2020) period to see how COVID-19 changes consumer behavior. Previously, we looked at exports to compare countries. We found that less virus burden correlated with more SleepPhones® exports. Now, we examine sales in all 50 U.S. states, alongside COVID-19 statistics.
SleepPhones Interest By State: Before COVID-19
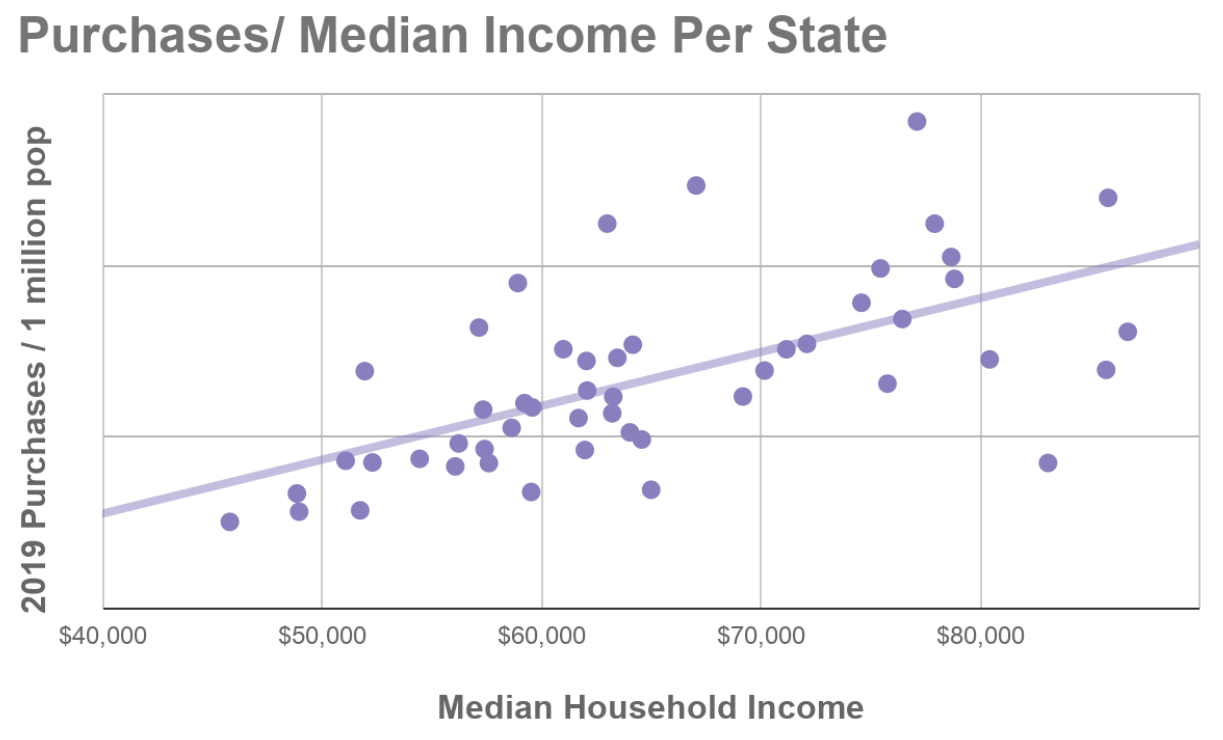
Every state has a pre-existing level of interest in buying SleepPhones® headphones. It largely correlates with median income. For every $10,000 more in median income, 33% more SleepPhones were purchased. The ten richest states (by median household income) bought 2.3 times more than the 10 poorest states in 2019. It makes sense that richer states buy more SleepPhones, and this doesn’t change much from year to year.
Change in Purchase Rate By State
Therefore, rather than looking at gross sales per population, we needed to look at the change in sales. For example, Massachusetts residents (median income $85,843) bought four times the number of SleepPhones compared with Mississippi residents (median income $45,792) in 2019. This is clearly due to the large gap in disposable income. During the pandemic, Massachusetts residents still bought more than Mississippi residents. But did Mississippi catch up or fall further behind? That change is listed in the second column of the table below, Change in Purchase Rate. We ordered the states based on change in purchase rate so it is clear which states bought more and which ones bought less than predicted from pre-pandemic sales.
Delaware residents seem to do better during the pandemic, buying nearly twice as many SleepPhones as before. Colorado consumers were far less confident, purchasing far less than predicted during the pandemic. Delaware’s median income is $70,176, and Colorado’s median income is $77,127, both above average for the US. So why did one state buy many more SleepPhones while the other buy far fewer? Did COVID-19 change their shopping habits, disposable income, or consumer confidence?
How Is COVID-19 Impacting Sales For Each State?
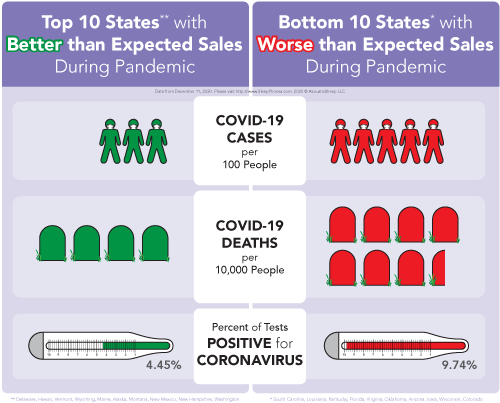
To figure out how COVID-19 impacted sales, we list the COVID-19 statistics per state from November 30 and whether or not a mask mandate was in place as of November 19. We can easily compare the top of the chart (better than expected sales) with the bottom of the chart (worse than expected sales). To accentuate the comparison, we can assess the numbers from the top ten versus the bottom ten.
The top ten states that bought more SleepPhones than expected are as follows:
- Delaware
- Hawaii
- Vermont
- Wyoming
- Maine
- Alaska
- Montana
- New Mexico
- New Hampshire
- Washington
These best-performing states average
- 3 COVID-19 cases per 100 people
- 3.9 COVID-19 deaths per 10,000 people
- 4.5% percent positivity (percent of tests positive for coronavirus)
- 72 tests performed per 100 people.
The bottom ten states that bought fewer SleepPhones than expected are as follows:
- South Carolina
- Louisiana
- Kentucky
- Florida
- Virginia
- Oklahoma
- Arizona
- Iowa
- Wisconsin
- Colorado
The worst-performing states average
- 4.8 COVID-19 cases per 100 people
- 7.2 COVID-19 deaths per 10,000 people
- 9.7% percent positivity (percent of tests positive for coronavirus)
- 52 tests performed per 100 people.
Here is the same information in a table format.
| Top Ten States* with Better Than Expected Sales During Pandemic | Bottom Ten States* With Worse Than Expected Sales During Pandemic | |
|---|---|---|
| COVID-19 Cases per 100 People | 3.06 | 4.76 |
| COVID-19 Deaths per 10,000 People | 3.9 | 7.2 |
| Percent of Tests Positive for Coronavirus | 4.45% | 9.74% |
| COVID-19 Tests per 100 People | 72.1 | 52.3 |
| *Delaware, Hawaii, Vermont, Wyoming, Maine, Alaska, Montana, New Mexico, New Hampshire, Washington | *South Carolina, Louisiana, Kentucky, Florida, Virginia, Oklahoma, Arizona, Iowa, Wisconsin, Colorado |
Case fatality rates were similar between the groups: 1.5% for the top ten states and 1.6% for the bottom ten states.
The Interesting Correlation Between Mask Mandates and Ecommerce Sales
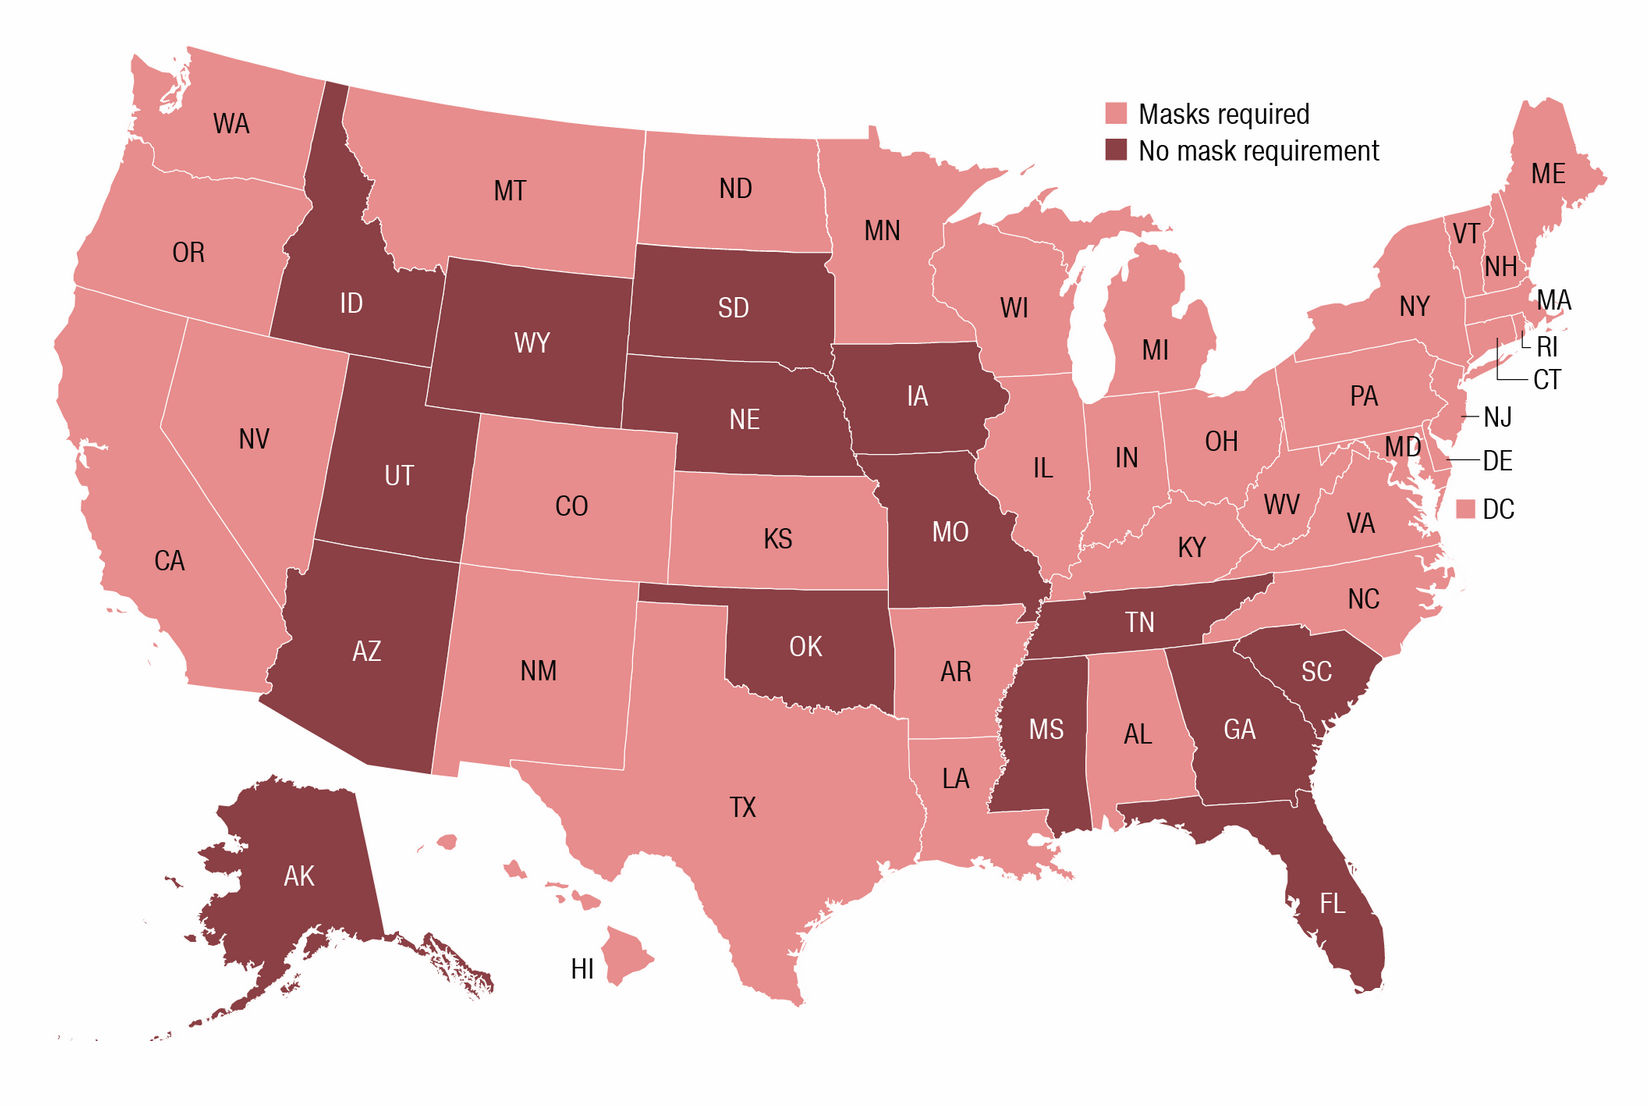
In late October, the media started to warn extensively of a surge in cases. We could see the cases spiking as we prepared to cast our vote in the presidential elections. It was no secret that we were heading into a bad winter. Various states instituted new mask mandates in early November. As of November 16, 15 states did not have a mask mandate. If we look at the top half of the chart where consumers bought more SleepPhones, 21 out of 25 states mandated masks. At the bottom of the chart where consumers consumed less, 16 out of 25 states mandated masks. Mask mandates correlate with better sales. Is it because mask mandates also correlate with more e-commerce due to less in-person retail? Or is it because mask mandates improve virus control and increase consumer confidence? Correlation of data can’t tell us these answers unfortunately.
Surprisingly (or perhaps not so), these results match our export results precisely. The less virus an area has, the more we sell to that area. The more controlled the virus is, the more we sell to that area. In the US, we can easily see that mask mandates positively correlate with sales.
Again, the COVID-19 statistics are simply correlated with sales changes. We don’t know how or why higher virus burdens or not requiring masks reduce sales. We can’t make assumptions on causation based on this type of data. But it’s remarkable how the US data comparing the 50 states show exactly the same trends as the export data comparing 30 countries. It really strengthens the correlations to have two different data sets prove the same points. These points were and remain:
- Less COVID-19 cases = more sales
- Less COVID-19 mortality = more sales
- Less COVID-19 percent positivity = more sales
- More COVID-19 testing = more sales
If our company represents the economy in a broader context, then the lower the virus burden, the better the economy.